A little tool to visualise MoE expert routing
I've been curious for a while about what's actually happening inside Mixture of Experts models when they generate tokens. Nearly every frontier model these days (Qwen 3.5, DeepSeek, Kimi, and almost certainly Opus and GPT-5.x) is a MoE - but it's hard to get an intuition for what "expert routing" actually looks like in practice.
So I built a small tool to visualise it: moe-viz.martinalderson.com
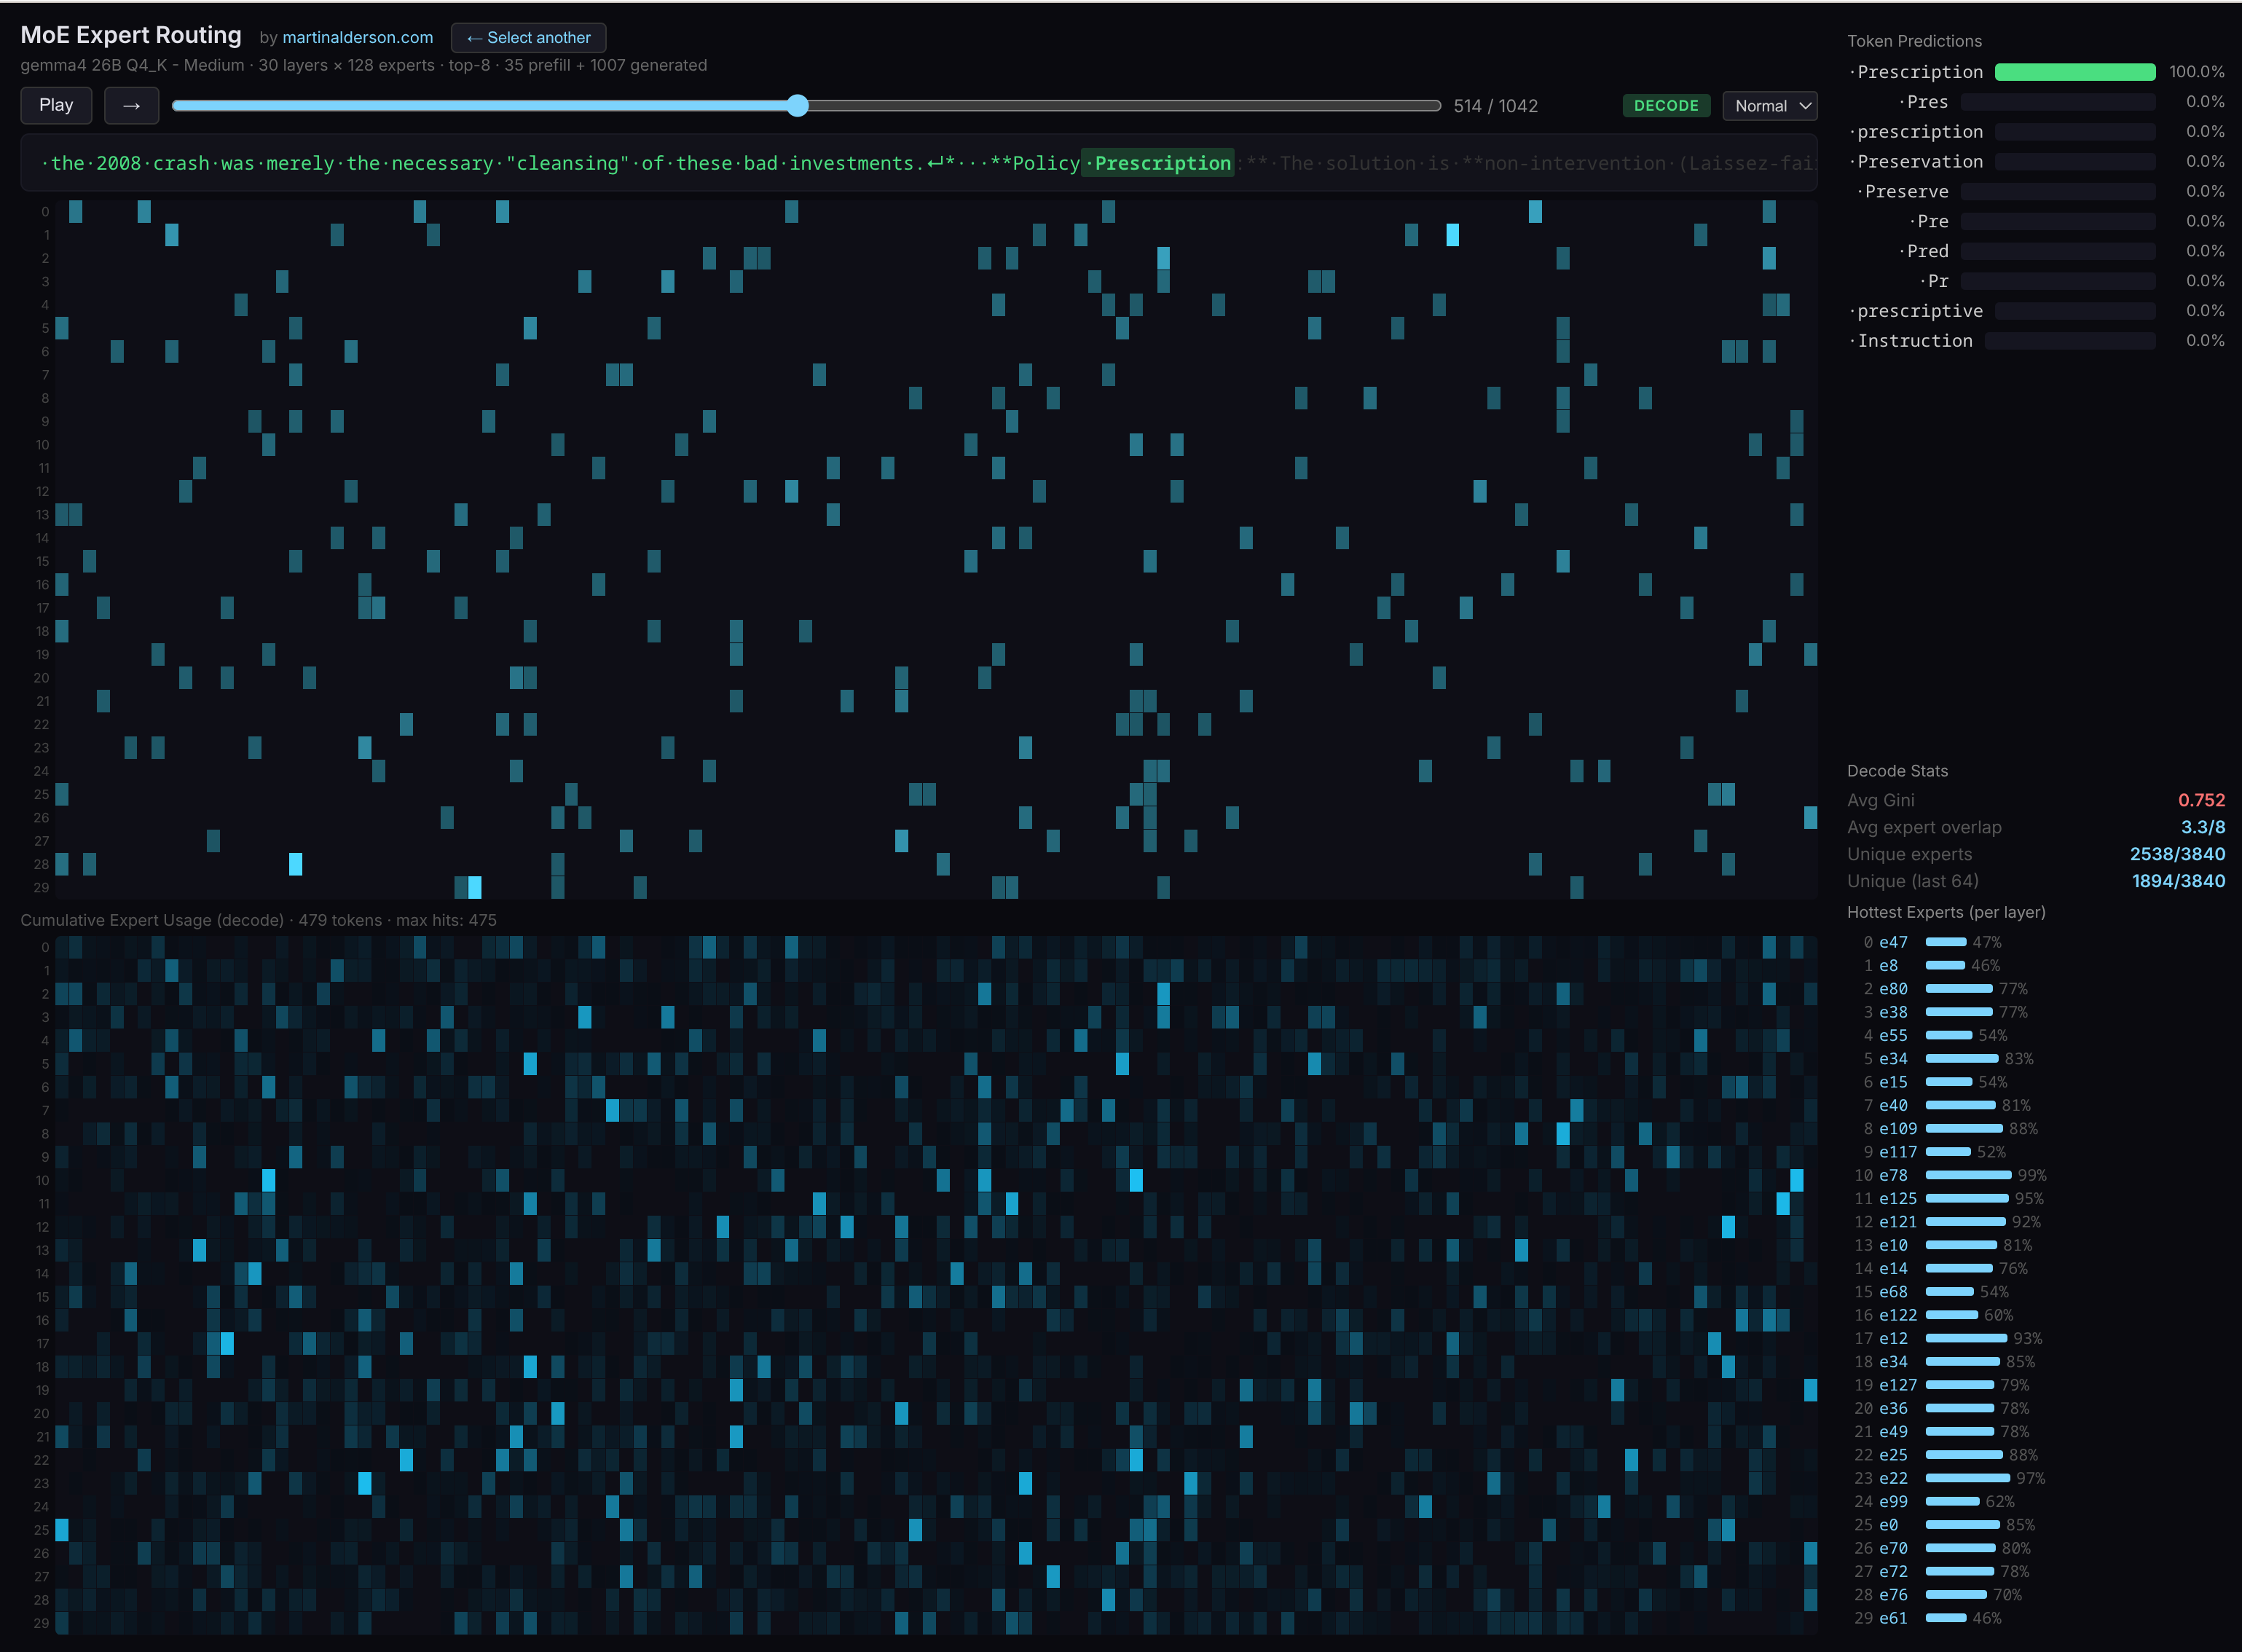
You can pick between a few different prompts, watch the generation animate out, and see exactly which experts fire at each layer for each token. The top panel shows routing as the token is generated, the bottom panel builds up a cumulative heatmap across the whole generation.
I built this by modifying the llama.cpp codebase to output more profiling data, with Claude Code's help. So it may have serious mistakes, but it was a really fun weekend project.
The thing that really surprised me: for any given (albeit short) prompt, ~25% of experts never activate at all. But it's always a different 25% - run a different prompt and a different set of experts goes dormant.
That's a much more interesting result than I expected. Interestingly Gemma 26BA4 runs really well with the "CPU MoE" feature - 4b params is not a lot to run on a fairly fast CPU and having KV cache on GPU really helps. I think there's a lot of performance improvements that could be done with MoE inference locally as well - eg caching certain experts on GPU vs CPU.
If you're interested in learning more about LLM inference internals I'd certainly recommend pointing your favourite coding agent at the llama.cpp codebase and getting it to explain the various parts - it really helped me learn a lot.